Examining Performance Anxiety and Co-Regulation in the Vocal Audition
performance-anxiety
heart-rate
co-regulation
MFA-2026
Abstract
Five singers performed mock auditions for a three-person faculty panel while all eight subjects wore Polar H10 heart rate monitors. Each singer sang two pieces: one prepared (singer’s choice) and one assigned 24 hours in advance. HR was recorded continuously at 1 Hz and aligned to audio recordings for phase-level analysis. Pre-screening captured music performance anxiety (K-MPAI, MAAQ) and post-performance surveys captured subjective experience from both singer and panelist perspectives.
This analysis traces the physiological arc of each audition, compares singer and panelist activation patterns, examines whether music performance anxiety predicts HR reactivity, and explores interpersonal synchrony between singers and their evaluators.
This is an exploratory study with five singers and three panelists. HR data was exported at 1 Hz (averaged BPM, not beat-to-beat intervals), so standard HRV metrics cannot be computed. Findings are descriptive and pattern-identifying, not generalizable.
Key Findings
The throughline: K-MPAI predicts HR dynamics (how much the heart rate swings), not HR magnitude (how high it goes). The same dynamic signal that tracks with music performance anxiety is what panelists read as confidence. The most anxious singer appears the most competent. Anxiety is physiologically invisible to the observer.
| Finding | Evidence |
|---|---|
| K-MPAI does not predict HR magnitude | S4 (K-MPAI 159) has the lowest HR on every measure. No consistent “more anxious = higher heart rate” pattern. |
| K-MPAI predicts HR Range (rs = +0.82) | Singers with higher MPA show wider HR swings during singing. The anxiety signal is in the volatility, not the level. |
| Two dimensions: magnitude tracks connection, dynamics track MPA | “Emotionally connected” correlates with mean HR (rs = +0.78). K-MPAI correlates with HR Range (rs = +0.82). Both coexist in the same singer. |
| No simple “assigned = more anxiety” pattern | Order confound (song 2 always follows song 1). Same-song HR trajectories correlate at r = +0.68 to +0.84. |
| Panelists misattribute the anxiety signal as confidence | S5 (highest K-MPAI, widest HR range) was rated most confident by all three panelists. The perception gap widens with MPA. |
| All five singers rated “felt anxious” at 4/5 | Cognitive anxiety was universal. Somatic expression varied along the dynamics dimension. |
| Studio dyads show opposite outcomes from the same relationship | S2 and S4 (both P3 studio students): opposite HR, opposite connection, opposite perception, same anxiety rating. |
| Three-panelist hierarchy is stable across all sessions | P1 ~98-108 bpm, P3 ~75-95 bpm, P2 ~54-70 bpm. Individual autonomic baselines, not session-dependent. |
Study Design
Participants: 5 singers (3 female, 2 male) and 3 faculty panelists, all wearing Polar H10 heart rate monitors.
Protocol: Each singer performed a mock audition: (1) pre-singing phase, (2) Song 1 (prepared, singer’s choice), (3) inter-song gap, (4) Song 2 (assigned 24 hours prior), (5) post-session.
Assigned pieces: Female singers (S2, S3, S4): “If You Knew My Story” | Male singers (S1, S5): “Shiksa Goddess”
Measures: Continuous HR (Polar H10, 1 Hz export), K-MPAI (Kenny Music Performance Anxiety Inventory, distributed to 330 conservatory voice students, 30 respondents, 9.1% response rate), MAAQ, post-performance Qualtrics surveys (separate singer/panelist versions).
Analysis Method
HR alignment: Audio recordings annotated with phase boundaries using Praat TextGrids. HR data aligned to audio using a clap-based sync point, producing second-by-second HR values tagged by audition phase.
Statistical approach: Descriptive statistics, Spearman rank correlations for anxiety-HR and survey-HR relationships, windowed cross-correlation (WCC) for moment-to-moment synchrony, smoothed whole-series correlation for trend-level coherence, wavelet coherence for frequency-resolved synchrony.
Data constraint: HR exported from Polar Flow at 1 Hz (averaged BPM per second, not beat-to-beat RR intervals). Standard HRV metrics cannot be computed. Analysis focuses on HR magnitude, reactivity, and interpersonal synchrony.
Results
The Audition Sessions
These sections present the raw HR data from each audition and the cross-session comparisons that establish the basic patterns. This foundational material is not specific to any single research question but provides the context for all subsequent analyses.
Individual Session Time Series
Each figure shows one audition session with the singer’s HR (red) overlaid with Panelist 1 (purple), Panelist 2 (green), and Panelist 3 (blue). Shaded bands indicate audition phases.
Panelist baseline context: The three panelists – all seated throughout – show a stable hierarchy across all sessions: Panelist 1 runs highest (~98-108 bpm), Panelist 3 is moderate (~75-95 bpm), and Panelist 2 is lowest (~55-65 bpm). Panelist 2’s HR is essentially resting heart rate for a seated adult. These individual differences in resting autonomic tone are consistent across all five sessions, suggesting stable trait-level variation rather than differential responses to specific singers.
Session 1 – Singer 1 (M)
Singer 1 begins around 127 bpm and ramps steadily upward through song 1 (prepared piece), reaching peaks near 160 bpm. There is a brief dip during the inter-song gap, followed by a sharp rise into song 2 (assigned piece), where HR reaches its highest sustained values (~155-158 bpm). The three panelists hold flat: Panelist 1 around 100-108 bpm, Panelist 3 at 85-95 bpm, and Panelist 2 near 58 bpm. The singer’s activation gap above the panelist mean is ~60-70 bpm during performance.
Session 2 – Singer 2 (F)
Singer 2 shows the steepest ramp-up of any singer – HR climbs from ~120 bpm at the start to peak near 169 bpm during song 1 (prepared). HR drops modestly during the inter-song gap (~145 bpm) but rebounds during song 2 (assigned), reaching ~155 bpm. Panelist 1 drifts from 108 down to ~100 bpm; Panelist 3 hovers in the 75-90 bpm range; Panelist 2 holds steady near 57 bpm. The activation gap widens as the session progresses.
Session 3 – Singer 3 (F)
Singer 3 follows a similar arc to Singer 2 – gradual climb through the pre-singing phase, sustained elevation during song 1 (135-165 bpm), partial recovery in the gap, and a plateau during song 2 (~150-158 bpm). Panelist 1 is steady around 101-107 bpm; Panelist 3 is at 80-95 bpm; Panelist 2 stays near 58-60 bpm. The inter-song gap shows a brief but noticeable HR spike in Panelist 3’s trace – likely anticipatory activation as the panelist prepares for the next performance (see Complementary Activation below).
Session 4 – Singer 4 (F)
Singer 4 is a clear outlier. HR starts around 80-90 bpm in the pre-singing phase – within the range typically seen in a panelist, not a singer. During song 1, HR rises modestly to ~105-120 bpm, well below the 140-170 bpm range seen in other singers. During song 2, HR actually drops below baseline, reaching the mid-70s. This is the most visually striking session in the dataset: the singer’s trace overlaps with Panelist 1 and Panelist 3, while Panelist 2 runs below all of them. Panelist 1 spikes to ~113 bpm during the inter-song gap – the highest P1 variability in any session (sd=5.8). Panelist 3 is similarly variable (sd=8.1 during the gap).
Important context: Panelist 3 is the private studio voice teacher for both Singer 2 and Singer 4. Panelist 1 had previously taught Singers 2, 4, and 5 in a classroom setting; Singers 1 and 3 had no prior relationship with Panelist 1. Singer 4’s reduced HR may reflect the familiarity of the studio teacher-student relationship, individual differences in autonomic reactivity, anxiolytic medication use (not screened for), or some combination. Notably, Singer 2 also has a studio relationship with Panelist 3 but shows the steepest HR ramp-up in the study, suggesting that the studio relationship alone does not explain Singer 4’s low HR.
Session 5 – Singer 5 (M)
Singer 5 shows the highest sustained HR of any participant. Starting from a pre-singing baseline of ~135-140 bpm (already elevated), HR climbs rapidly through song 1 to peaks near 184 bpm. The inter-song gap provides minimal recovery (~165 bpm), and song 2 drives HR to its highest sustained values (~170-180 bpm). The three panelists form a clear floor: Panelist 1 at 96-106 bpm, Panelist 3 at 73-85 bpm, Panelist 2 at 54-59 bpm. The widest activation gap in the study occurs here – ~91 bpm between singer and the 3-panelist mean during song 2.
RQ1: How Do Self-Reported Anxiety and K-MPAI Scores Relate to Physiological Responses?
K-MPAI does not predict how high heart rate goes during the audition, but it does predict how much it swings. HR Range during singing correlates with K-MPAI at rs = +0.82. The anxiety signal is in the volatility, not the level.
Self-Report Measures: K-MPAI, MAAQ, and Post-Surveys
This section presents the self-report data that frame the physiological findings: how anxious these singers report being (trait measures), how they experienced the audition (singer post-surveys), and how the panelists perceived them (faculty post-surveys). The correlations between these measures and HR are presented below.
K-MPAI and MAAQ Pre-Survey Results
The K-MPAI was distributed to 330 conservatory voice students (216 BFA and 114 Vocal Arts, undergraduate and graduate). 30 responded (9.1% response rate). The 5 study participants were drawn from this respondent pool. Scoring follows Kenny (2009): 40 items on a 0-6 scale with 8 reverse-coded positive items (1, 2, 9, 17, 23, 33, 35, 37), range 0-240, clinical threshold >=105.
Respondent pool (30 of 330 surveyed conservatory voice students, 9.1% response rate):
- Mean K-MPAI: 127.6 (SD 30.8), Median: 129.0, Range: 64-185
- 77% (23/30) score >=105 (clinically significant MPA)
- Self-selection caveat: Respondents opted into a study about performance anxiety. Students who experience more performance anxiety may have been more motivated to participate, likely inflating the clinical rate relative to the broader conservatory voice population. The 77% characterizes the respondent pool, not conservatory singers as a whole.
Study participants:
| Singer | K-MPAI | Clinical? | MAAQ Flexibility | Notes |
|---|---|---|---|---|
| S1 | 126 | Yes | 31 | Near population mean |
| S2 | 111 | Yes | 35 (highest) | Lowest anxiety, highest flexibility |
| S3 | 144 | Yes | 26 | Above population mean |
| S4 | 159 | Yes | 21 | High anxiety despite lowest HR |
| S5 | 174 | Yes | 17 (lowest) | Highest anxiety, lowest flexibility |
All 5 singers score above the clinical threshold – not surprising given they self-selected for a study on performance anxiety. The rank ordering is notable: Singer 5 (highest K-MPAI, 174) also shows the highest sustained HR in the study, while Singer 2 (lowest K-MPAI, 111) shows the steepest HR ramp-up but also the most recovery between songs. Singer 4 (K-MPAI 159 – second highest) is the most interesting case: high self-reported anxiety with the lowest physiological response. Several factors may contribute, including the studio relationship with Panelist 3, individual autonomic differences, or anxiolytic medication (not screened for in this study).
Faculty panelists:
| Panelist | K-MPAI | Clinical? | MAAQ Flexibility | Mean HR (seated) |
|---|---|---|---|---|
| Panelist 1 | 109 (2 items missing) | Yes | 24 | ~101 bpm |
| Panelist 2 | 102 | No | 33 | ~58 bpm |
| Panelist 3 | 169 | Yes | 32 | ~85 bpm |
Panelist 3’s K-MPAI (169) is notably high – higher than any study participant except Singer 5. For a panelist whose own performance anxiety is elevated, evaluating singers (especially her own student, Singer 4) may carry additional physiological weight. Panelist 2 falls just below the clinical threshold at 102 and shows the lowest HR of anyone in the study – essentially resting heart rate while seated. The K-MPAI ranking on the faculty side (P3 > P1 > P2) does not map directly to their HR ranking (P1 > P3 > P2), but Panelist 2 being the calmest on both measures is consistent.
Limitation: The study did not screen for anxiolytic medication use (beta blockers, SSRIs, benzodiazepines) in singers or faculty panelists. Any participant using such medication could show attenuated HR responses that do not reflect their underlying anxiety level.
Anxiety-HR Correlations
K-MPAI x HR Magnitude
Does higher music performance anxiety (MPA) predict higher physiological arousal during the audition? With n = 5 singers, Spearman rank correlations are used. The critical value for significance at p < 0.05 (two-tailed) with n = 5 is |r_s| = 1.000, so no correlation can reach conventional significance. These are descriptive rank-order patterns, not inferential tests.
| Anxiety Measure | HR Measure | r_s | p |
|---|---|---|---|
| K-MPAI Total | Mean Song HR | +0.10 | 0.873 |
| K-MPAI Total | Peak HR | +0.10 | 0.873 |
| K-MPAI Total | HR Reactivity | -0.30 | 0.624 |
| K-MPAI Total | Activation Gap | +0.10 | 0.873 |
| MAAQ Flexibility | Mean Song HR | -0.10 | 0.873 |
| MAAQ Raw Sum | Mean HR (Assigned Song) | -0.87 | 0.054 |
No meaningful K-MPAI-HR association. Singer 4’s position breaks any monotonic pattern: she has the second-highest K-MPAI (159) but the lowest HR across every measure. If Singer 4 were removed, the remaining four singers show a near-monotonic positive relationship between K-MPAI and Mean Song HR. Several factors may contribute to Singer 4’s low HR: the pre-existing studio teaching relationship with Panelist 3, individual differences in autonomic reactivity, or anxiolytic medication use (not screened for in this study). With n = 5, a single case can shift the entire correlation.
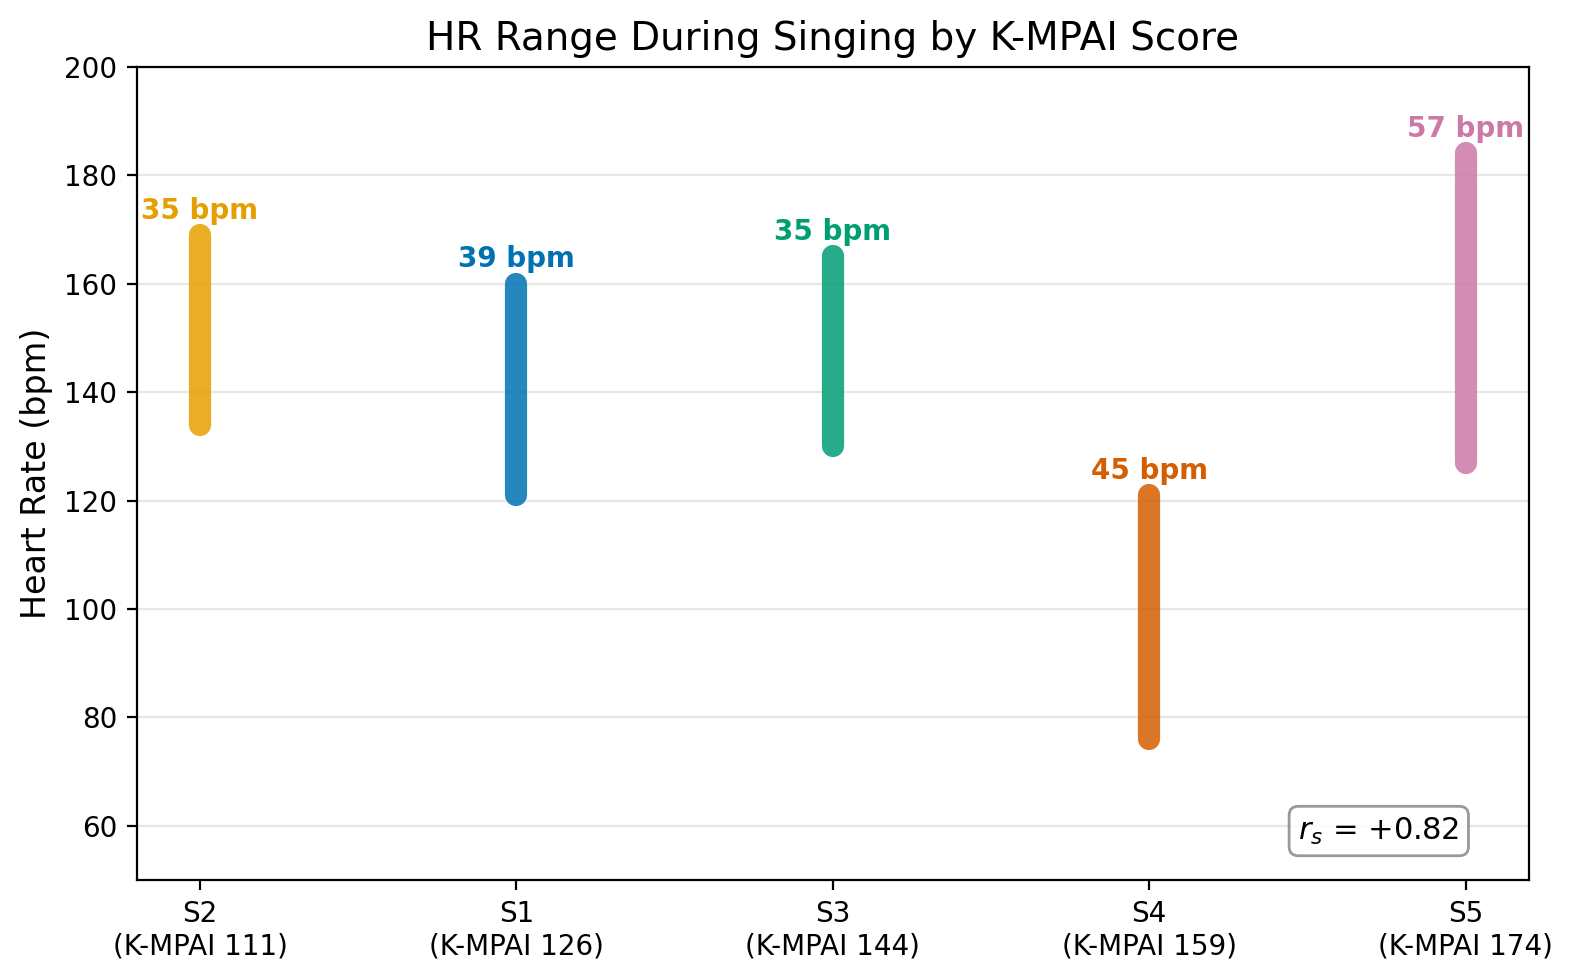
Each vertical bar shows a singer’s HR range during singing (min to max across both songs). Bars widen as K-MPAI increases: the anxiety signal is in the volatility, not the level. rs = +0.82.
K-MPAI Predicts HR Range
While K-MPAI does not predict where HR sits, it does predict how much HR moves during singing. HR Range (max minus min HR during song phases) correlates with K-MPAI at rs = +0.82: singers with higher music performance anxiety show wider HR swings.
S5 (K-MPAI 174) has the widest range. S2 (K-MPAI 111) has the narrowest. S4 (K-MPAI 159, lowest absolute HR) still shows a wide range relative to her baseline, consistent with her K-MPAI rank.
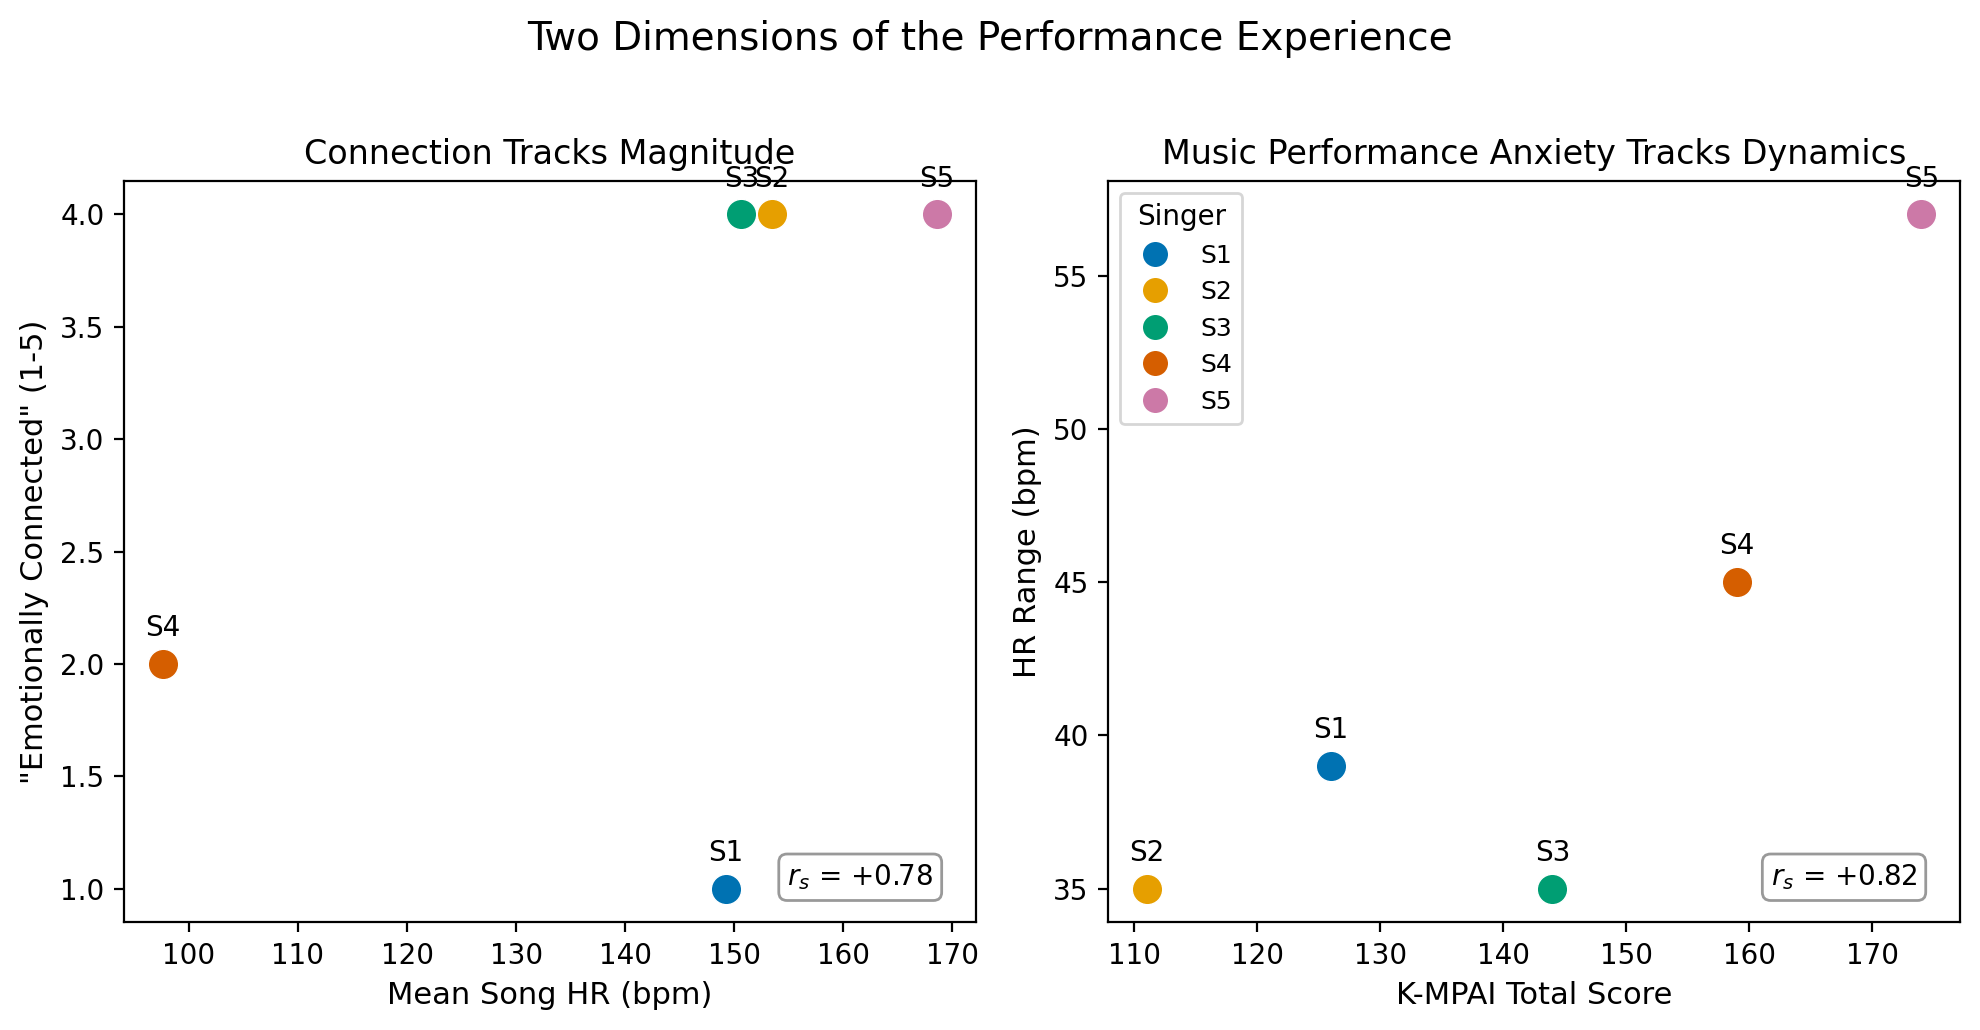
Left: emotional connection tracks HR magnitude (rs = +0.78). Right: music performance anxiety tracks HR Range (rs = +0.82). Connection lives in how high; MPA lives in how volatile.
Two Dimensions of the Performance Experience
The same elevated heart rate produces two separable experiences:
Magnitude (how high HR goes) maps onto emotional connection. Singers with higher mean song HR reported feeling more emotionally connected (rs = +0.78). Physiological activation during performance is not purely aversive: it coexists with engagement.
Dynamics (how much HR swings) maps onto music performance anxiety. K-MPAI predicts HR Range (rs = +0.82). The anxiety dimension lives in the volatility of the heart rate, not the level.
These two dimensions coexist in the same singer. S2 has high magnitude (153 bpm) and narrow range (35 bpm). S5 has high magnitude (168 bpm) and wide range (57 bpm). Both feel connected; S5’s connection comes with more volatile physiological underpinning. Every singer rated “felt anxious” at 4/5. Cognitive anxiety was universal. The somatic expression maps onto the dynamics dimension.
RQ2: Does the Assigned Piece Elicit Greater Stress Than the Prepared Piece?
The data does not show a simple “assigned piece = more anxiety.” Some singers (S1, S3, S5) show higher HR during song 2; S2 shows lower. The comparison is confounded by order (song 2 always follows song 1).
When singers perform the same assigned piece, their HR trajectories correlate at r = +0.68 to +0.84 (smoothed). The song imposes a shared HR contour through its respiratory demands, phrasing structure, and intensity arc. The individual stress response determines the set point, not the shape. S4 runs 60 bpm below S2 and S3 during the same song but tracks the same contour (r = +0.70).
Same-song comparison figures are available in the Methodological Appendix.
RQ4: Do Panelist Physiological Responses Relate to Their Perceptions?
This section examines the panelist side of the audition experience: how faculty ratings of singer performance relate to singer HR, whether panelists show anticipatory physiological activation, and how the three panelists’ distinct HR profiles relate to their anxiety measures and perceptual patterns.
Panelist Perception and Physiology
Note: In the Thesis Results Guide, the panelist perception analysis uses HR Range (max minus min during singing) rather than mean song HR, following the RQ1 finding that K-MPAI predicts HR dynamics, not magnitude. “Appeared confident” vs HR Range shows a consistent positive pattern across all three panelists (P1 rs = +0.67, P2 rs = +0.67, P3 rs = +0.78). The figure below uses mean song HR and is retained as supplementary reference.
Faculty panelists rated each singer on 6 items after each audition. All three panelists watched each performance simultaneously, so ratings of a single singer’s performance are correlated.
Primary Analysis: Singer-Averaged Ratings (n = 5)
The 3 panelists’ ratings are averaged per singer, then correlated with singer HR. This gives n = 5 independent observations.
| Panelist Item | vs Singer Mean HR (r_s) | p |
|---|---|---|
| Appeared confident | +0.50 | 0.391 |
| Showed signs of anxiety | -0.70 | 0.188 |
| Felt authentic | -0.31 | 0.614 |
| Emotionally connected | -0.26 | 0.668 |
| Emotionally disconnected | -0.10 | 0.870 |
| Appeared to enjoy performing | +0.58 | 0.306 |
Key observations:
“Appeared confident” x Singer HR retains a positive direction (r_s = +0.50) but with an honest p = 0.391. Panelists rated higher-HR singers as appearing more confident, not less.
“Showed signs of anxiety” x Singer HR is the strongest faculty-perception correlation (r_s = -0.70). Higher-HR singers were rated as showing fewer signs of anxiety. Physiological stress was not visible to the panelists.
Per-panelist breakdown reveals that Panelist 2 drives the “Appeared confident” pattern (r_s = +0.87), while Panelist 3 shows no relationship (r_s = -0.11). Panelist 3 (highest K-MPAI, studio teacher to both S2 and S4) does not perceive high-HR singers as more confident. Panelist 2 (lowest anxiety, most stable HR) shows the strongest perceptual tracking.
Panelist 3’s perception gap with her own students. Panelist 3’s post-survey ratings diverge from her students’ self-reports in both cases, though in opposite directions. For S2: Panelist 3 rates S2 as emotionally disconnected (5/5) and not confident (2/5); S2 self-reports connected (4/5), not disconnected (1/5), and confident (4/5). For S4: Panelist 3 rates S4 as confident (4/5) and connected (4/5); S4 self-reports confident (3/5) and connected (2/5). In both cases, the studio teacher’s perception of her student’s internal experience is inverted relative to the student’s own report. This pattern does not appear for Panelists 1 and 2.
The Three-Panelist Hierarchy
The three panelists occupy distinct and stable HR bands across all five sessions:
| Panelist | Overall Mean HR | SD Range | K-MPAI | Notes |
|---|---|---|---|---|
| Panelist 1 | ~98-108 bpm | 1.2-5.8 | 109 | Highest resting HR; wore a facial mask throughout |
| Panelist 3 | ~75-95 bpm | 2.0-8.1 | 169 | Most variable; Singer 4’s voice teacher |
| Panelist 2 | ~54-70 bpm | 0.3-5.2 | 102 | Lowest HR; minimal variability; essentially resting |
Panelist 2’s HR is notable for its remarkable stability, often with standard deviations below 2 bpm during performance phases. This is consistent with Panelist 2’s K-MPAI of 102 (just below the clinical threshold), suggesting lower sympathetic arousal in the evaluator role. Panelist 3’s K-MPAI of 169, the highest of any participant including the singers, and correspondingly higher HR variability suggest that performance anxiety in the panelist may manifest as greater physiological responsiveness to the audition context.
Panelist 1’s elevated baseline (~100 bpm) may be partially attributable to wearing a facial mask throughout the experiment, though consistency across all five sessions suggests a stable individual difference rather than a progressive masking effect.
The gradient of complementary activation (Panelist 3 > Panelist 1 > Panelist 2) parallels the gradient of overall HR variability and K-MPAI scores: the panelist with the highest music performance anxiety shows the most physiological responsiveness to the audition context, while the panelist with the lowest music performance anxiety shows essentially resting-level physiology throughout.
Singer-Panelist Agreement
The singer and faculty post-surveys share six parallel items. For each of the 15 singer-panelist pairs (5 singers x 3 panelists), the mismatch score is the panelist’s rating minus the singer’s self-report. Positive values mean the panelist rated higher; negative means the panelist underestimated.
Overall Agreement
Across 90 observations (5 singers x 3 panelists x 6 items), 36 showed exact agreement (40%). Cohen’s kappa, which adjusts for chance agreement, is 0.139 (“slight” agreement). Singer and panelist perceptions of the same performance barely converge beyond what chance would produce.
The heatmap reveals the pattern: blue cells indicate items where the panelist rated higher than the singer’s self-report, red cells where the panelist rated lower, and white where they agreed exactly.
Mismatch by Panelist
| Panelist | K-MPAI | Mean | Mismatch | |
|---|---|---|---|---|
| Panelist 1 | 109 | 0.93 | +0.27 | 0.007 |
| Panelist 2 | 102 | 0.77 | +0.07 | 0.128 |
| Panelist 3 | 169 | 0.97 | -0.37 | 0.271 |
Panelist 2, who has the lowest K-MPAI score (102, sub-clinical), is the most accurate perceiver across all singers and items. Panelist 3, who has the highest K-MPAI (169, clinical), shows the largest mismatches with her own studio students (S2 and S4).
Mismatch by Singer
| Singer | K-MPAI | Mean | Mismatch |
|---|---|---|---|
| S1 | 126 | 0.50 | Connected (+1.0 across panelists) |
| S2 | 111 | 1.00 | Disconnected (+2.7 across panelists) |
| S3 | 144 | 0.67 | Anxious (-1.0 across panelists) |
| S4 | 159 | 0.83 | Connected (+2.0 across panelists) |
| S5 | 174 | 1.33 | Confident (+1.7 across panelists) |
S1 is the most “readable” singer (mean |mismatch| = 0.50). S5 is the most misperceived (1.33), with all three panelists consistently overestimating confidence and authenticity while underestimating anxiety.
Mismatch by Item
| Item | Mean | Mismatch | |
|---|---|---|---|
| Confident | 0.80 | +0.20 | Slight overestimate |
| Anxious | 0.87 | -0.47 | Underestimate (panelists see less anxiety than singers feel) |
| Authentic | 0.67 | +0.53 | Overestimate (panelists see more authenticity than singers feel) |
| Connected | 1.27 | +0.60 | Largest overestimate |
| Disconnected | 1.33 | +0.47 | Largest absolute divergence |
| Enjoyed | 0.87 | -0.33 | Slight underestimate |
Panelists systematically underestimate singer anxiety and overestimate perceived authenticity and emotional connection. The “Disconnected” item shows the largest absolute divergence across all singer-panelist pairs, driven primarily by the S2-Panelist 3 pair (mismatch = +4).
What RQ4 Reveals
The perception mismatch data converge with the RQ4 findings to form a consistent picture: anxiety is physiologically invisible to panelists. The “felt anxious” item shows the strongest directional underestimation (mean signed mismatch = -0.47), meaning panelists consistently perceived less anxiety than singers reported. This parallels the RQ4 finding that “showed signs of anxiety” was inversely correlated with singer HR (rs = -0.70): panelists rated higher-HR singers as showing fewer signs of anxiety. The two findings reinforce each other from different angles. RQ4 shows that physiological stress does not leak into observable behavior. RQ4 shows that subjective anxiety does not leak into observable behavior either.
S5 is the clearest single case. S5 has the highest K-MPAI in the study (174), the highest sustained HR (mean 169 bpm), and self-reported moderate confidence (3/5) and high anxiety (4/5). Yet Panelists 1 and 2 both rated S5 as the most confident singer (5/5 each) and saw little anxiety (2/5 each). The highest-anxiety singer was perceived as the most confident performer.
The panelist-level pattern is equally informative. Panelist 2 (K-MPAI 102, sub-clinical, lowest and most stable HR) is the most accurate perceiver across all singers. Panelist 3 (K-MPAI 169, clinical, most variable HR) shows the largest mismatches, especially with her own studio students. The panelist with the least physiological reactivity reads singers most accurately. The panelist with the most physiological reactivity reads her own students least accurately. This connection between panelist anxiety and perceptual accuracy is explored further in the Case Study below.
Case Study: Evaluator Self-Regulation and Perceptual Accuracy
The study’s most important pedagogical finding emerges from contrasting the two most different panelists. No separate figure: this section references Items 1, 8, and the mismatch data above.
P2: The Regulated Evaluator
| Measure | Value |
|---|---|
| K-MPAI | 102 (sub-clinical, the only participant below threshold) |
| HR | ~54-70 bpm, remarkably stable (SD often < 2 bpm). Essentially resting. |
| Perception accuracy | Most accurate reader. Lowest mean absolute mismatch (0.77). Tracks singer physiology in ratings (rs = +0.87 for “appeared confident”). |
P3: The Responsive Evaluator
| Measure | Value |
|---|---|
| K-MPAI | 169 (highest of any participant, higher than four of five singers) |
| HR | ~75-95 bpm, most variable across sessions (SD up to 8.1). Strongest physiological coupling with both studio students. |
| Perception accuracy | Largest mismatches with her own students. S2 mismatch = 2.00 (largest of any pair). Inverts both students’ self-reports in opposite directions. |
The Dissociation
The same studio relationship (P3 teaching S2 and S4) produces opposite outcomes on every measure:
| Measure | S2 | S4 |
|---|---|---|
| Mean Song HR | 153 bpm | 98 bpm |
| Reactivity | +32 bpm | +15 bpm |
| Self-reported confidence | 4/5 | 3/5 |
| Self-reported connection | 4/5 | 2/5 |
| Felt anxious | 4/5 | 4/5 |
| P3 “Appeared confident” | 2/5 | 4/5 |
| P3 “Disconnected” | 5/5 | 2/5 |
P3 underestimates the engaged, high-HR student (S2) and overestimates the disengaged, low-HR student (S4). P1 and P2 do not show this inversion.
P3’s “Disconnected” rating for S2 (+4 mismatch) is the largest single-item mismatch in the entire dataset.
The Pedagogical Takeaway
Physiological coupling and perceptual accuracy are independent. P3 couples most strongly with both students yet reads them least accurately. Being physiologically attuned to a student, feeling what they feel in your own body, does not mean you can accurately read their experience.
P2 demonstrates the alternative: a regulated evaluator, one with low MPA and a stable physiological state, reads singers most accurately. The panelist who remains physiologically calm is the one who sees most clearly.
The implication for voice pedagogy: Evaluator self-regulation supports perceptual accuracy. Teachers who manage their own performance anxiety may be better positioned to accurately read their students during high-stakes moments.
Limitations
This section consolidates the study’s limitations. Per-analysis limitations are detailed within their respective sections.
- Data resolution: HR was exported from Polar Flow at 1 Hz (averaged BPM per second), not beat-to-beat RR intervals. Standard HRV metrics cannot be computed. The 1 Hz resolution also limits within-window variability for WCC (RQ3), contributing to Panelist 2’s 95% exclusion rate.
- Sample size: With 5 singers, Spearman correlations cannot reach p < 0.05 unless the rank ordering is perfectly monotonic. All correlations are descriptive.
- Pre-existing relationships: Panelist 3 is the private studio voice teacher for both Singer 2 and Singer 4. Panelist 1 had prior classroom teaching experience with Singers 2, 4, and 5; Singers 1 and 3 had no prior relationship with Panelist 1. These relational histories are confounds that cannot be fully separated from individual autonomic differences. Singer 2 and Singer 4 share the same studio relationship with Panelist 3 yet show opposite HR profiles (S2 highest ramp-up, S4 lowest overall HR), limiting any familiarity-based interpretation.
- No medication screening: The study did not screen for beta blockers, SSRIs, or benzodiazepines, which could attenuate HR responses.
- Order confound: Song 2 (assigned) always follows song 1 (prepared), so any assigned-piece effect is inseparable from a second-performance effect.
- Gendered repertoire: Female and male singers sang different assigned pieces, limiting cross-gender comparison.
- No pianist: All performances used backing tracks (unintentional but serves as a control).
- Multiple comparisons: Over 50 correlations computed across RQ3 through RQ4. Even the one p = 0.037 result (K-MPAI x HR Range) would not survive Bonferroni correction.
Methodological Appendix: A Toolkit for Continuous HR Research in Performance Settings
The core narrative above traces the throughline from music performance anxiety through HR dynamics to panelist perception. The sections below demonstrate the full analytical range of what continuous 1 Hz heart rate data can yield in a performance research paradigm. These exploratory analyses provide depth for readers who want it and a methodological reference for researchers designing similar studies.
Trajectory Characterization
How to describe the shape of a stress response, not just the level. Pre-performance activation, within-song trajectory features, growth curves, and normalized comparisons.
HR Dynamics
The two strongest anxiety-HR correlations in the dataset are both about how heart rate moves, not where it sits. The pre-performance activation trajectory (rs = -0.90) captures how singers ramp up before singing. The HR range during songs (rs = +0.90) captures how much HR fluctuates during performance.
Pre-Performance Activation Trajectory
The mean pre-singing HR describes where singers start, but not how they got there. Using song event markers from manually verified TextGrids, each song phase was subdivided into finer segments (track intro, singing, post-singing), allowing us to trace HR from audition onset through the waiting period, instrumental intro, and into singing itself.
The pre-singing period varies in duration across sessions (17 to 85 seconds). During this time, the singer stands before the panel, speaks briefly, and prepares to perform.
Individual trajectories (HR at audition onset to track intro):
| Singer | K-MPAI | HR at Clap | Last 5s of Pre-Singing | Track Intro HR | Total Change | Pattern |
|---|---|---|---|---|---|---|
| S2 | 111 | 121 | 143 | 143 | +22 | Steady ramp across 41s |
| S3 | 144 | 121 | 140 | 135 | +15 | Ramp then slight dip when track starts |
| S1 | 126 | 127 | 126 | 126 | -1 | Flat (17s wait) |
| S4 | 159 | 92 | 99 | 88 | -4 | Oscillates, drops when track starts |
| S5 | 174 | 137 | 128 | 130 | -7 | Peaks at 158 around 30-40s, then declines |
The total HR change from audition onset to track intro correlates strongly with K-MPAI: rs = -0.90, p = 0.037. This is the strongest anxiety-HR correlation in the dataset.
This correlation is not about the instrumental intro. The 5-8 second track intro is too short to produce HR change independent of the ongoing trajectory. Decomposing the rise:
| Component | rs with K-MPAI | p |
|---|---|---|
| Total rise (clap to intro) | -0.90 | 0.037 |
| Pre-singing ramp (clap to last 5s) | -0.70 | 0.188 |
| Intro-specific effect (last 5s to intro) | 0.00 | 1.000 |
The pre-singing ramp drives the correlation. The track intro adds nothing.
Interpretation: Lower K-MPAI singers show a classic pre-performance activation ramp (HR steadily climbs from arrival to singing onset). Singer 2 is the clearest example: calm arrival at 121 bpm, steady climb to 143 across 41 seconds. Higher K-MPAI singers show blunted or inverted trajectories. Singer 5 arrives already elevated, peaks at 158 around 30-40 seconds in, then declines to 128 by track onset. Singer 4 oscillates modestly and drops when the music begins. This is consistent with the anxiety physiology literature, where high-music-performance-anxiety individuals sometimes show paradoxically blunted acute responses, consistent with tonic arousal or avoidant coping reducing available dynamic range. The correlation captures dynamic range, not absolute level: absolute pre-singing mean HR shows no K-MPAI correlation (rs = +0.05).
Confound: Pre-singing duration trends with K-MPAI (rs = +0.70, p = 0.188). Longer waits give more time for HR to change and cannot be disentangled from the activation trajectory with n = 5.
The Song 2 pattern (second panel above) is weaker (rs = -0.60, p = 0.285), with most singers showing negative values: HR during the Song 2 intro is lower than during the inter-song gap, likely because the gap already carries elevated HR from Song 1.
Trajectory Features
The mean-level correlations above collapse each singer’s entire song performance into a single HR value. This section preserves temporal structure by extracting trajectory features from HR time series during each song phase and fitting individual growth curves.
Trajectory Features
Five features were extracted from each singer’s HR during song_1 and song_2, then averaged across both songs:
- Slope: linear regression slope of HR over normalized time (0 = song onset, 1 = song offset). Using normalized time avoids a confound with song duration.
- AUC above baseline: area under the HR curve above the singer’s pre-singing baseline HR, normalized by duration (bpm above resting).
- Time to Peak: seconds from phase start to maximum HR
- HR Range: max minus min HR within the phase (amplitude of fluctuation)
- Recovery: HR at phase end minus HR at phase start (positive = continued climbing, negative = recovery)
| Feature | K-MPAI r_s | p | MAAQ Flex. r_s | p |
|---|---|---|---|---|
| Slope (bpm/norm. time) | +0.70 | 0.188 | -0.70 | 0.188 |
| AUC above baseline (bpm) | -0.30 | 0.624 | +0.30 | 0.624 |
| Time to Peak | +0.30 | 0.624 | -0.30 | 0.624 |
| HR Range | +0.90 | 0.037 | -0.90 | 0.037 |
| Recovery | +0.70 | 0.188 | -0.70 | 0.188 |
Key findings:
- HR Range is the strongest trajectory-anxiety association (r_s = +0.90, p = 0.037, uncorrected). Higher music performance anxiety predicts wider HR fluctuation during singing. Slope and Recovery also show positive associations with K-MPAI (r_s = +0.70 each) but do not reach conventional significance. These trajectory features reveal information that mean HR obscures. Unlike the near-zero K-MPAI x Mean Song HR correlation (r_s = +0.10), the trajectory features capture the dynamic quality of the stress response.
Note: All p-values are uncorrected for multiple comparisons. Across the full analysis, over 50 correlations are computed. Even the one p = 0.037 result (HR Range) would not survive Bonferroni correction. All correlations should be treated as exploratory pattern descriptions.
Singer 4 no longer breaks the pattern for HR Range. In the mean HR analyses, Singer 4’s low absolute HR (despite high K-MPAI) produced flat correlations. But Singer 4’s range is actually consistent with moderate-to-high K-MPAI: she shows meaningful HR fluctuation (23-40 bpm range) even though her absolute HR stays low. The trajectory features reveal that Singer 4’s autonomic system is responding to the performance, just from a lower set point.
Recovery is positive for all singers. No singer shows net HR recovery within either song phase. All singers’ HR is still climbing or elevated at the end of each song.
Anticipatory Anxiety
Four of five singers show pre-singing HR values of 126-143 bpm – substantially elevated above typical resting heart rate (60-80 bpm for young adults). This is consistent with Vellers et al. (2017), who identified the pre-performance anticipatory period as the most sensitive window for detecting audition stress. The singers are already in a state of sympathetic activation before they begin singing. Singer 4, again, is the exception at ~91 bpm.
Performance Activation: Track Intro to Singing
The pre-performance trajectory above captures what happens before singing. A complementary pattern emerges during singing: the HR rise from track intro to singing mean (averaged across both songs) shows a clear rank-order relationship with K-MPAI.
| Singer | K-MPAI | Track Intro HR | Singing Mean HR | Rise (bpm) |
|---|---|---|---|---|
| S2 | 111 | 143.0 | 154.4 | +11.5 |
| S1 | 126 | 138.6 | 149.8 | +11.1 |
| S3 | 144 | 140.0 | 151.6 | +11.6 |
| S4 | 159 | 83.8 | 98.9 | +15.1 |
| S5 | 174 | 147.4 | 169.9 | +22.5 |
S5 (highest K-MPAI) rises +22.5 bpm from track intro to singing mean. S2 (lowest K-MPAI) rises +11.5 bpm. S4’s rise (+15.1) is consistent with her K-MPAI rank despite her low absolute HR.
The immediate jump (track intro to first 5 seconds of singing) shows no K-MPAI pattern. The escalation builds over the full song duration, suggesting sustained performance-related activation rather than an acute startle response.
Two-part activation story: Before singing, higher K-MPAI is associated with less anticipatory ramp (the pre-singing trajectory above). During singing, higher K-MPAI is associated with more escalation from track start. High-anxiety singers arrive pre-activated with less room to climb, then escalate more steeply once performance demands begin.
Singer Self-Report x Heart Rate
Singers completed an 8-item post-performance survey (1-5 Likert) immediately after their audition. Each item is correlated with their mean song HR.
Critical finding: “Felt anxious” has zero variance. All five singers rated their anxiety at 4 out of 5. With no rank-order variance, the correlation is undefined. This is itself a substantive result: every singer, including Singer 4 (whose HR was near panelist levels), self-reported high anxiety. The audition context produced a universal subjective experience of anxiety regardless of the physiological response, consistent with research showing that cognitive and somatic anxiety components can dissociate.
| Survey Item | Direction | vs Mean Song HR (r_s) |
|---|---|---|
| Felt confident | positive | +0.35 |
| Felt anxious | negative | NaN (no variance) |
| Felt authentic | positive | 0.00 |
| Felt safe to express | positive | 0.00 |
| Emotionally connected | positive | +0.78 |
| Emotionally disconnected | negative | -0.05 |
| Enjoyed performing | positive | +0.37 |
| Did not feel satisfaction | negative | +0.63 |
“Emotionally connected” shows the strongest positive correlation with HR (r_s = +0.78, p = 0.118). Singers with higher HR reported feeling more emotionally connected to their performance, not less. This is consistent with the idea that physiological activation during performance is not purely aversive: it can coexist with engagement and emotional presence.
Studio Student Contrast: S2 vs S4
Both Singer 2 and Singer 4 are studio students of Panelist 3. They share the same relationship type with the same panelist, yet show opposite HR profiles and opposite subjective experiences.
| Item | S2 | S4 |
|---|---|---|
| Mean Song HR | 153 bpm | 98 bpm |
| Felt confident | 4 | 3 |
| Felt anxious | 4 | 4 |
| Felt safe to express | 5 | 4 |
| Emotionally connected | 4 | 2 |
| Emotionally disconnected | 1 | 3 |
| Enjoyed performing | 5 | 3 |
| Did not feel satisfaction | 2 | 3 |
S2 (high HR) reports feeling confident, safe, connected, and joyful. S4 (low HR) reports lower confidence, lower connection, and less enjoyment. Both rate anxiety at 4/5. Low heart rate does not equal comfort: S4’s flat HR coexists with a less positive subjective experience, while S2’s steep HR ramp-up coexists with the most positive self-report in the study.
This contrast connects to two broader findings. First, the “emotionally connected” positive correlation with HR (r_s = +0.78): S2’s high connection rating and high HR are consistent with the pattern, while S4’s low connection and low HR reinforce it. Second, the “felt anxious” ceiling: both singers rate anxiety at 4/5 despite a 55 bpm HR difference, reaffirming that cognitive anxiety and somatic arousal dissociate in this context.
Cross-Session and Same-Song Comparisons
How to compare across performers and conditions when singers perform the same repertoire.
A. Same-Song Comparisons with Panelists
Because the assigned piece was the same within each gender group, we can compare singers’ HR during the identical musical material. Any differences in HR trajectory during the same song reflect individual anxiety responses rather than differences in musical demands.
Female Singers – "If You Knew My Story"
During the assigned piece (right panel) – the same 32-bar cut – Singers 2 and 3 track closely in the 140-155 bpm range with similar contour, while Singer 4 starts at ~80 bpm and rises slowly to ~99 bpm. The separation between Singer 4 and the other two is even more striking here than during the prepared pieces, because the musical demands are identical.
Each female singer during "If You Knew My Story" with all three panelists overlaid:
- Singer 2: Sustained at 140-155 bpm. All three panelists hold flat below, with Panelist 2 running lowest (~57 bpm). The singer sits 40-80+ bpm above the panelist range.
- Singer 3: Similar profile to Singer 2. Panelist traces are stable and well below.
- Singer 4: Starts at ~80 bpm – below Panelist 1 (~98 bpm) and near Panelist 3 (~92 bpm). Only Panelist 2 (~56 bpm) is consistently below her. This is the only session where the singer’s HR is intertwined with the panelists’ during active singing.
Male Singers – "Shiksa Goddess"
During the assigned piece (right panel), Singer 5 starts at ~166 bpm and climbs to ~180 bpm. Singer 1 starts at ~149 bpm and rises gently to ~158 bpm. The ~15-20 bpm gap between them is consistent, suggesting a stable difference in stress reactivity rather than a response to a specific musical moment.
Each male singer during "Shiksa Goddess" with all three panelists:
- Singer 1: Flat trace at ~150-158 bpm. All three panelists well below. The gap between singer and 3-panelist mean (~70 bpm) is stable throughout.
- Singer 5: Climbing trace from ~166 to ~180 bpm. The gap widens over the course of the song – panelists hold flat or decrease while Singer 5 continues climbing. Panelist 3 shows the clearest antiphase pattern (HR decreasing as singer’s increases).
B. Singer-to-Singer HR During Identical Pieces
The previous section showed each singer alongside their panelists during the same song. This subsection removes the panelists and asks: how do singers’ HR time series compare when they perform the same song?
The assigned piece (song 2) provides a natural control. All three female singers (S2, S3, S4) sang “If You Knew My Story,” and both male singers (S1, S5) sang “Shiksa Goddess.” Because the song is identical within each group, the respiratory demands, musical structure, phrasing, and emotional arc are held constant. Any commonalities in HR trajectory shape reflect song-driven physiological effects. Any differences in absolute HR level reflect individual stress response.
Song 2 durations are tightly clustered (54-58 seconds). Both absolute-time alignment (from song onset) and normalized-time alignment (0-1) are used. Pairwise Pearson correlations are computed on the raw, normalized, and 5-second smoothed time series.
Male Singers: “Shiksa Goddess” (S1 and S5)
| Singer | Duration | HR Range | Mean HR | K-MPAI |
|---|---|---|---|---|
| S1 | 58s | 149-158 | 154.4 | 126 |
| S5 | 58s | 163-182 | 169.9 | 174 |
Pairwise correlation: r = +0.80 (normalized), r = +0.84 (smoothed).
S1 and S5 produce nearly parallel HR trajectories: a steady upward ramp with a slight dip around the 30-40% mark, then a sustained climb to the end. S5 is offset approximately 15 bpm above S1 throughout. The shape is almost identical; the offset tracks with K-MPAI (174 vs. 126). Between-singer SD on the mean trajectory is only 7.8 bpm.
Female Singers: “If You Knew My Story” (S2, S3, S4)
| Singer | Duration | HR Range | Mean HR | K-MPAI |
|---|---|---|---|---|
| S2 | 56s | 134-157 | 147.4 | 111 |
| S3 | 55s | 141-158 | 151.8 | 144 |
| S4 | 54s | 76-99 | 89.5 | 159 |
Pairwise correlations (normalized time):
| Pair | r | r (smoothed) |
|---|---|---|
| S2-S3 | +0.27 | +0.29 |
| S2-S4 | +0.68 | +0.71 |
| S3-S4 | +0.70 | +0.73 |
S3 and S4 are strongly correlated (r = +0.70) despite being 60 bpm apart. S2-S4 similarly correlated (r = +0.68). But S2 and S3, despite similar absolute HR levels (147 vs. 152 bpm), correlate only weakly (r = +0.27), suggesting that at similar activation levels, individual-level factors (breath management, performance strategy) can override the song-driven pattern.
What This Shows
The song imposes a shared HR contour. Singers performing the same piece correlate at r = +0.68 to +0.84 (smoothed). The musical material drives a common autonomic pattern through its respiratory demands, phrasing structure, and intensity arc.
The individual stress response determines the set point, not the shape. S4 is 60 bpm below the other female singers but tracks the same contour as S3. S5 is 15 bpm above S1 but follows the same shape. K-MPAI predicts how high a singer’s HR is. The song determines when it rises and falls.
This helps explain the singer-panelist synchrony findings in RQ3. The song drives a structured HR response in the singer. The panelists hear the same song. This likely accounts for the trend-level coherence concentrated at longer timescales: both singer and panelists respond to the musical arc, but through different mechanisms (respiratory demand vs. perceptual engagement).
Cross-Session Comparisons
Singer HR by Audition Phase
The grouped bar chart below shows each singer’s mean HR (with standard deviation bars) during the four performance phases. The pattern is consistent across four of five singers: HR is lowest during pre-singing, rises sharply for song 1, dips slightly during the inter-song gap, and remains elevated or continues rising into song 2. Singer 4 is the exception – her HR stays in the 88-106 bpm range across all phases, never approaching the 140+ bpm levels seen in the others.
Key observation: Pre-singing baseline HR is remarkably similar across Singers 1, 2, 3, and 5 (~126-143 bpm), suggesting comparable levels of anticipatory anxiety before singing begins. Singer 4’s pre-singing HR (~91 bpm) is 35-50 bpm lower than the group.
Singer-Panelist Activation Gap
The chart below quantifies the HR difference between each singer and the mean of all three panelists for each phase. The gap reflects how far the singer’s autonomic activation exceeds the panelists’ – a rough index of the anxiety asymmetry in the audition relationship. With Panelist 2 included (mean HR ~58 bpm, seated), the 3-panelist average is lower than the earlier 2-panelist estimate, so activation gaps are wider.
Singers 1, 2, 3, and 5 show gaps of 38-91 bpm, widening as the session progresses. The gap is largest during the inter-song gap and song 2 for most singers – suggesting that the stress of performing the assigned piece (less familiar, less rehearsed) compounds the already elevated state from song 1.
Singer 4’s gap is small but positive (+8 bpm during song 2) – her HR stays close to the panelist range. This is the only singer whose physiological state approximates the panelists’.
HR Reactivity Profiles
The dot-and-line plot below connects each singer’s mean HR across the four phases, making the shape of each stress response visible.
Four distinct profiles emerge:
- Singer 5 – highest absolute HR, steep climb, no recovery between songs. The most pronounced stress response in the study.
- Singer 2 – steep initial climb during song 1, partial recovery in the gap, rebound for song 2. Classic performance anxiety arc.
- Singers 1 and 3 – moderate, steady climb. Singer 1 shows the most gradual escalation; Singer 3 plateaus earlier.
- Singer 4 – flat trajectory near 90 bpm. Modest rise during song 1, return to baseline for song 2. This profile resembles a panelist more than a performer.
Normalized HR Trajectories
All five singers’ HR traces plotted on a common timeline, each zeroed to their own pre-singing baseline mean. This removes differences in resting HR and shows the magnitude of change from baseline.
With a 10-second rolling average for readability:
- Singers 2 and 5 show the largest sustained elevations (~25-40 bpm above baseline).
- Singer 1 shows a moderate, steady rise (~15-30 bpm above baseline).
- Singer 3 shows a moderate rise with more variability.
- Singer 4 shows the smallest reactivity – peaking around +15 bpm during song 1, then dropping below baseline during song 2.
Note: In the Thesis Results Guide, LOESS-smoothed trajectory overlays replace R2 shape classifications. The student describes visible trajectory shapes rather than using the categorical labels below. The R2 values and shape labels remain here as supplementary reference.
Individual Growth Curves
For each singer and song phase, HR was modeled over normalized time (0 = song onset, 1 = song offset) using both linear and quadratic regression. The quadratic fit captures inverted-U or U-shaped trajectories that a linear model would miss.
| Singer | Song | Shape | Linear R2 | Quad R2 | Notes |
|---|---|---|---|---|---|
| S1 | Prepared | Ramp-up | 0.852 | 0.861 | Steady linear climb |
| S1 | Assigned | Ramp-up | 0.733 | 0.736 | Steady linear climb |
| S2 | Prepared | Inverted-U | 0.044 | 0.913 | Classic arc: rise then fall |
| S2 | Assigned | Ramp-up | 0.353 | 0.384 | Shifts to climb pattern for new piece |
| S3 | Prepared | Inverted-U | 0.739 | 0.794 | Rise with late plateau |
| S3 | Assigned | Inverted-U | 0.418 | 0.599 | Moderate arc |
| S4 | Prepared | Inverted-U | 0.013 | 0.428 | Rise and fall within panelist range |
| S4 | Assigned | Ramp-up | 0.889 | 0.889 | Pure linear climb from low baseline |
| S5 | Prepared | Inverted-U | 0.797 | 0.894 | Steep climb with late plateau near 180 bpm |
| S5 | Assigned | U-shape | 0.799 | 0.902 | Brief early dip then steep climb |
Interpretive notes:
S2 prepared piece is the most dramatic inverted-U (R2 improvement = +0.87). A linear model explains almost nothing (R2 = 0.04), while the quadratic captures 91% of variance.
The prepared-to-assigned shift changes trajectory shape. Three singers (S2, S4, S5) show different shapes between songs. The assigned piece may not allow enough time or familiarity for the downslope of the inverted-U to emerge.
S1 is the most consistently linear. Both songs show high linear R2 (0.73-0.85) with negligible quadratic improvement.
Synchrony and Co-Regulation Methods
Three complementary approaches to quantifying whether singer and panelist heart rates move together: windowed cross-correlation (moment-to-moment), smoothed correlation (trend-level), and wavelet coherence (frequency-resolved). Plus studio dyad case studies and complementary activation patterns.
RQ3: Does Physiological Co-Regulation Occur Between Performers and Panelists?
Co-regulation was examined using three complementary synchrony methods: windowed cross-correlation (moment-to-moment), smoothed whole-series correlation (trend-level), and wavelet coherence (frequency-resolved). The strongest evidence for co-regulation comes from the two studio teacher-student dyads (S4-P3 and S2-P3), which show distinctive but different coupling patterns.
Studio Dyads
The S4-P3 Dyad: A Case Study in Co-Regulation
Singer 4 is a student of Panelist 3, as is Singer 2. Both have pre-existing private studio teacher-student relationships with Panelist 3. Panelist 1 had prior classroom teaching experience with Singers 2, 4, and 5, though in a group setting rather than one-on-one; Singers 1 and 3 had no prior relationship with Panelist 1. These relational contexts are important interpretive lenses, but cannot be isolated as causal explanations for Singer 4’s low HR. Several factors may contribute:
Singer 4’s low HR is consistent with reduced evaluative threat. Performing for one’s own studio teacher – someone who knows your voice, has heard you at your worst, and is invested in your success – may reduce the sense that resources are insufficient to meet demands (the “threat” state in the biopsychosocial model; Guyon et al., 2020). However, Singer 2 also has a studio relationship with Panelist 3 and shows the steepest HR ramp-up in the study (peaking near 169 bpm), demonstrating that the studio relationship alone does not reduce evaluative threat. The three singers who had a classroom relationship with Panelist 1 (S2, S4, S5) show HR responses spanning the full range of the study, further suggesting that familiarity with a panelist is not a primary determinant. Individual differences in autonomic reactivity, coping style, or other unmeasured factors likely contribute independently.
The HR convergence between Singer 4 and Panelist 3 is consistent with what Coutinho et al. (2021) describe in established relationships. While Singer 4 and Panelist 3 are not romantic partners, the private studio relationship represents the closest interpersonal bond of any singer-panelist dyad in this study, and it produces the most convergent physiological profile in terms of HR magnitude. Notably, the S2-Panelist 3 pair shows the highest trend-level coherence of any pair in the dataset (smoothed r = +0.771), meaning S2’s and Panelist 3’s HR trajectories move in the same direction over each song, even though S2 runs 60-80 bpm above Panelist 3 in absolute terms. Both studio dyads show distinctive coupling, but at different timescales: S4-Panelist 3 = magnitude convergence (HR traces in the same range), S2-Panelist 3 = trajectory co-movement (HR traces sharing shape, not level).
All three panelists show elevated variability during Singer 4’s session. Panelist 3’s HR is the most variable of any session (sd=8.1 during the inter-song gap). Panelist 1 also shows its highest variability here (sd=5.8, spiking to ~113 bpm). Even Panelist 2, typically the most stable, shows slightly more variation.
S2-P3: Trajectory Co-Movement
Singer 2 also has a studio relationship with Panelist 3, and shows the highest trend-level coherence of any pair in the dataset (smoothed r = +0.771). Unlike S4-Panelist 3, where the coupling is in magnitude (HR traces occupying the same absolute range), S2-Panelist 3 shows trajectory co-movement: their HR trajectories track the same broad directional arc across each song, especially during the assigned piece (+0.897), despite S2 running 60-80 bpm above Panelist 3. The two studio dyads thus demonstrate two distinct coupling signatures from the same relationship type.
Studio Dyad Synchrony Comparison: S2-Panelist 3 vs S4-Panelist 3
Both Singer 2 and Singer 4 are studio students of Panelist 3. The table below compares their synchrony profiles across all three methods.
| Method | Metric | S2-P3 | S4-P3 | All-Pair Mean | Highest Non-Studio |
|---|---|---|---|---|---|
| WCC | Mean lag-0 r | -0.079 (rank 12/15) | +0.034 (rank 8/15) | +0.070 | S4-P1: +0.364 |
| Smoothed r | Mean r | +0.771 (rank 1/15) | +0.386 (rank 8/15) | +0.220 | S4-P2: +0.719 |
| Wavelet | Mean coherence | 0.502 (rank 5/15) | 0.471 (rank 6/15) | 0.489 | S3-P1: 0.679 |
Per-song breakdown:
| Pair | Method | Song 1 (Prepared) | Song 2 (Assigned) |
|---|---|---|---|
| S2-P3 | WCC r | +0.058 | -0.216 |
| S2-P3 | Smoothed r | +0.644 | +0.897 |
| S2-P3 | Wavelet coh. | 0.605 | 0.399 |
| S4-P3 | WCC r | +0.134 | -0.067 |
| S4-P3 | Smoothed r | +0.297 | +0.474 |
| S4-P3 | Wavelet coh. | 0.487 | 0.454 |
What this shows:
Neither studio dyad dominates across methods. S2-Panelist 3 leads all 15 pairs in trend-level coherence (smoothed r = +0.771) but ranks 12th in WCC. S4-Panelist 3 ranks 8th in both. Neither is highest in wavelet coherence.
The two dyads couple differently. S2-Panelist 3’s coupling is concentrated in trend-level co-movement: their HR trajectories track the same broad arc, especially during the assigned song (+0.897), despite S2 running 60-80 bpm above Panelist 3. S4-Panelist 3’s coupling is in magnitude convergence: their HR traces occupy the same absolute range, but the correlations are unremarkable.
Both studio dyads show stronger trend coherence than the all-pair mean. S2-Panelist 3 (+0.771) and S4-Panelist 3 (+0.386) both exceed the dataset mean (+0.220). Four of the top 8 smoothed r pairs involve Panelist 3, suggesting that Panelist 3’s higher HR variability (associated with her elevated K-MPAI of 169) creates more signal for trend-level coupling to detect.
WCC is near zero or negative for both studio dyads. The studio relationship does not produce rapid physiological mirroring; it produces shared directional movement at a slower timescale.
Complementary Activation: Singer Recovery and Panelist Activation
The inter-song gap and singing onset reveal a complementary oscillation between singers and panelists. During the gap, singers uniformly recover (mean -9.6 bpm, range: -0.4 to -20.0) while panelists generally activate (mean +3.7 bpm). At singing onset (track intro to first 10 seconds of singing), the pattern reverses: singers activate (mean +2.2 bpm) while panelists settle (mean -2.0 bpm).
This is a form of co-regulation through turn-taking: when one side of the audition relationship is “on,” the other is regulating. The singer recovers while the panelists carry the anticipatory load, then the singer activates while the panelists settle.
Panelist 3 during Singer 4’s session is the most dramatic example: P3 ramps +19.2 bpm during the gap (the largest single change in the dataset), then drops -5.7 bpm once S4 starts singing. The studio teacher carries the anticipatory load for her student.
The gradient of panelist activation (P3 > P1 > P2) parallels the gradient of overall HR variability and K-MPAI (P3 = 169, P1 = 109, P2 = 102).
Synchrony Analyses
Windowed Cross-Correlation (WCC)
This section quantifies the degree to which singer and panelist HR move together during performance, using windowed cross-correlation (WCC). This addresses RQ3: does physiological coupling (synchrony) occur between singer and panelist during the audition?
Method
Following Moulder et al. (2018), WCC was computed with: - Window: 10 seconds (captures meaningful HR fluctuation at 1 Hz) - Step: 5 seconds (50% overlap) - Max lag: +/-8 seconds (physiological response latency) - Primary metric: mean detrended Pearson r at lag 0
Within each window, both signals are linearly detrended before correlation. Windows where either signal has SD < 0.5 bpm are excluded (the “near-constant guard,” primarily affecting Panelist 2).
Surrogate testing: Each singer’s HR was paired with each panelist’s HR from other sessions (session-swap). This preserves temporal structure while breaking real coupling.
Panelist 2 Exclusion Rate
Panelist 2’s HR was near-constant in 95% of windows (188 of 198 excluded). Panelist 2 cannot contribute meaningful synchrony data, confirming the near-resting physiological state observed in The Audition Sessions.
WCC Results
| Singer | Panelist 1 (mean r) | Panelist 3 (mean r) | Panelist 2 (mean r) | Notes |
|---|---|---|---|---|
| S1 | +0.23 | +0.23 | +0.04 | Moderate positive synchrony |
| S2 | +0.19 | -0.08 | -0.36 | Positive with Panelist 1 only |
| S3 | +0.07 | -0.01 | +0.03 | Near zero across all panelists |
| S4 | +0.36 | +0.03 | +0.45 | Strongest Panelist 1 coupling |
| S5 | +0.03 | -0.15 | NaN | Panelist 3 shows antiphase pattern |
Key observations:
Singer 4 shows the strongest synchrony, but with Panelist 1, not Panelist 3. The S4-Panelist 1 pair has the highest mean r across both songs (+0.36), with particularly strong coupling during song_2 (r = +0.55). The studio teacher-student pair (S4-Panelist 3) shows near-zero coupling (+0.03).
Singer 5 and Panelist 3 show the only consistent antiphase pattern (mean r = -0.15). Panelist 3’s HR tends to move opposite to Singer 5’s during performance.
Most real pairs do not clearly exceed surrogates. With n = 5 and short song durations, statistical power is low. This question remains open for larger studies.
Trend-Level Cardiac Coherence (Smoothed Whole-Series Correlation)
The WCC analysis (above) detrends each 10-second window before computing correlations, targeting moment-to-moment fluctuation coupling. However, visual inspection of the HR time series suggests a broader pattern: singer and panelist HR traces often share the same general contour over the course of a song, rising and falling together at a timescale of 15-60 seconds. The WCC detrending removes exactly this kind of slow co-movement.
To test whether this trend-level coherence is real, both HR signals are smoothed with a 15-second centered moving average, then a single Pearson correlation is computed on the full smoothed series for each singer-panelist-song pair.
| Pair | Song 1 r | Song 2 r | Mean r |
|---|---|---|---|
| S1-P1 | +0.391 | -0.838 | -0.224 |
| S1-P3 | +0.537 | -0.940 | -0.202 |
| S2-P1 | -0.860 | +0.857 | -0.002 |
| S2-P3 | +0.644 | +0.897 | +0.771 |
| S3-P1 | +0.462 | +0.857 | +0.660 |
| S3-P3 | +0.541 | +0.337 | +0.439 |
| S4-P1 | -0.168 | +0.068 | -0.050 |
| S4-P3 | +0.297 | +0.474 | +0.386 |
| S5-P1 | +0.506 | +0.270 | +0.388 |
| S5-P3 | +0.405 | +0.496 | +0.451 |
P2 omitted from table (near-constant HR). Mean smoothed r across all 30 pairs: +0.220. Range: -0.940 to +0.897.
S2-Panelist 3 (+0.771) is the highest mean smoothed r of any pair. Singer 2 and Panelist 3 share a studio teacher-student relationship, and their HR trajectories track in the same direction across both songs (song 1: +0.644, song 2: +0.897). This is coherence in shape, not magnitude: S2 runs 60-80 bpm above Panelist 3 in absolute terms. Combined with the S4-Panelist 3 magnitude convergence discussed above, the two studio dyads show that the teacher-student relationship is associated with distinctive coupling at different timescales.
Seven of 30 pairs exceed 95% of session-swap surrogates. K-MPAI vs Mean Smoothed r: rs = +0.000, p = 1.000. Trend-level coherence is not associated with anxiety level, suggesting shared environmental response rather than anxiety-driven coupling.
Wavelet Coherence
Wavelet coherence decomposes both HR signals into time-frequency space using a continuous Morlet wavelet transform, measuring coherence (0 to 1) at each combination of time and period (timescale). This reveals where in the song and at what timescale the coupling is strongest.
Periods analyzed: 6 to 58 seconds (limited by song duration). The coherence heatmaps show coherence concentrated at longer timescales (30-58s periods), confirming that singer-panelist coupling is a slow, broad phenomenon.
| Pair | Song 1 Coh. | Song 2 Coh. | Mean Coh. |
|---|---|---|---|
| S1-P1 | 0.557 | 0.297 | 0.427 |
| S1-P3 | 0.469 | 0.312 | 0.391 |
| S2-P1 | 0.443 | 0.394 | 0.419 |
| S2-P3 | 0.605 | 0.399 | 0.502 |
| S3-P1 | 0.706 | 0.651 | 0.679 |
| S3-P3 | 0.554 | 0.642 | 0.598 |
| S4-P1 | 0.435 | 0.466 | 0.451 |
| S4-P3 | 0.487 | 0.454 | 0.471 |
| S5-P1 | 0.514 | 0.388 | 0.451 |
| S5-P3 | 0.511 | 0.412 | 0.462 |
Mean coherence across all 30 pairs: 0.489. Six of 30 pairs exceed 95% of surrogates. S3-P1 song_1 shows the highest coherence (0.706, z = +3.95). K-MPAI vs Wavelet Coherence: rs = -0.100, p = 0.873.
How the Three Synchrony Analyses Relate
| Analysis | Timescale | What It Detects | Key Finding |
|---|---|---|---|
| WCC (the WCC analysis) | 5-10s fluctuations | Moment-to-moment coupling after detrending | Mostly null; few pairs exceed surrogates |
| Smoothed r (the smoothed correlation analysis) | 15s+ trends | Broad HR trajectory co-movement | Strong coherence in many pairs (mean r = +0.22) |
| Wavelet (this analysis) | 6-58s decomposed | Multi-scale coherence, localized in time | Moderate coherence concentrated at 30s+ periods |
The three analyses converge: singer and panelist HR share broad arcs over the course of a song, but this shared trajectory is not driven by anxiety level and does not extend to moment-to-moment fluctuation coupling.
Full-Session Coherence (Pre-Singing Through Post-Session)
The previous synchrony analyses examined synchrony during the two song phases only. But the aligned HR data for each session spans five phases: pre-singing, song 1, inter-song gap, song 2, and post-session. The pre-singing phase captures anticipatory activation (singers at 126-143 bpm before singing a note), the inter-song gap captures panelist anticipatory ramps (Panelist 3 ramping +17.7 bpm before Singer 4’s second song), and the post-session phase captures any immediate recovery. These are some of the most interesting periods for co-regulation evidence, and they fall outside the song windows analyzed above.
Why extend the analysis? The song-phase synchrony results (the smoothed correlation and wavelet analyses) showed trend-level co-movement during active singing (mean smoothed r = +0.22, mean wavelet coherence = 0.489). But they couldn’t answer a critical question: is this co-movement part of a broader shared physiological arc across the entire audition, or is it specific to the performance period? If singer and panelist HR co-move before, during, and after singing, that strengthens the case for a shared autonomic response to the audition environment. If the co-movement is song-specific, the non-performance phases tell a different story.
What we ran: Smoothed whole-series correlation and wavelet coherence on the full session time series (pre-singing through post-session) for each singer-panelist pair, with surrogate testing. WCC (the WCC analysis) was not extended because the non-song phases are too short (pre-singing as brief as 17s, inter-song gap as brief as 18s) and WCC was already mostly null during the longer song phases.
Full-Session Durations (per subject)
| Session | Pre-Singing | Song 1 | Inter-Song Gap | Song 2 | Post-Session | Total |
|---|---|---|---|---|---|---|
| S1 | 17s | 207s | 25s | 59s | 10s | 318s |
| S2 | 41s | 85s | 40s | 57s | 15s | 238s |
| S3 | 39s | 147s | 20s | 56s | 13s | 276s |
| S4 | 53s | 165s | 32s | 55s | 13s | 319s |
| S5 | 84s | 165s | 18s | 59s | 12s | 340s |
Full-Session Smoothed Correlation
| Pair | Full-Session r | Song-Only Mean r | Delta |
|---|---|---|---|
| S1-P1 | +0.294 | -0.224 | +0.518 |
| S1-P3 | +0.450 | -0.202 | +0.651 |
| S2-P1 | -0.606 | -0.002 | -0.605 |
| S2-P3 | +0.198 | +0.771 | -0.573 |
| S3-P1 | -0.387 | +0.660 | -1.046 |
| S3-P3 | +0.185 | +0.439 | -0.254 |
| S4-P1 | -0.228 | -0.050 | -0.179 |
| S4-P3 | +0.082 | +0.386 | -0.304 |
| S5-P1 | +0.286 | +0.388 | -0.102 |
| S5-P3 | +0.487 | +0.451 | +0.036 |
P2 omitted from table (near-constant HR within songs, though included in full-session analysis where slow drift produces higher variability). Mean full-session smoothed r across all 15 pairs: +0.002, vs. song-only +0.220. Mean shift: -0.218.
The positive co-movement observed during songs collapses to near zero when the full session is analyzed. Song-only and full-session r values are essentially uncorrelated (r_s = +0.15, p = 0.594). The trend coherence during active singing is not part of a broader shared physiological arc. The anticipatory, transitional, and recovery phases introduce divergent patterns (asymmetric anticipatory responses, different recovery trajectories) that wash out the during-performance signal.
Full-Session Wavelet Coherence
| Pair | Full-Session Coh. | Song-Only Mean Coh. | Delta |
|---|---|---|---|
| S1-P1 | 0.602 | 0.427 | +0.175 |
| S1-P3 | 0.521 | 0.391 | +0.131 |
| S2-P1 | 0.499 | 0.419 | +0.081 |
| S2-P3 | 0.566 | 0.502 | +0.064 |
| S3-P1 | 0.615 | 0.679 | -0.064 |
| S3-P3 | 0.508 | 0.598 | -0.090 |
| S4-P1 | 0.559 | 0.451 | +0.108 |
| S4-P3 | 0.513 | 0.471 | +0.042 |
| S5-P1 | 0.576 | 0.451 | +0.125 |
| S5-P3 | 0.563 | 0.462 | +0.102 |
Mean full-session wavelet coherence: 0.565 (vs. song-only 0.489, +0.075 increase). Three of 15 pairs exceed 95% of surrogates.
Wavelet coherence moves in the opposite direction from smoothed correlation: it increases at the full-session level. This is not contradictory. Wavelet coherence captures coupling at specific timescales and time points, including the transitions between phases (onset of singing, inter-song gap, end of performance). These shared time-locked events boost coherence at specific scales even when the overall linear trend correlation is near zero.
What This Tells Us
Linear trend co-movement is song-specific. The mean positive correlation during songs (+0.220) disappears at the full-session level (+0.002). When a singer’s HR ramps up in anticipation, the panelists’ HR may or may not do the same, and the patterns differ across sessions.
Scale-specific coherence extends beyond songs. Coherence at 30s+ timescales persists and strengthens at the full-session level. The phase transitions themselves create shared time-locked events that register as coherence.
The distinction matters for co-regulation claims. The full-session results suggest something more modest than full-arc co-regulation: singer and panelists share a common response to the audition structure (event-locked coherence) and show directional co-movement during active singing (trend coherence), but neither pattern extends cleanly across the full session. This is consistent with a shared environmental response rather than direct interpersonal entrainment.
Full-Session vs. Song-Only Comparison
Perception Detail
The full evidence behind the perception gap: familiarity effects, singer-by-singer comparison tables, and the complete mismatch data.
K-MPAI Scoring Note
The Qualtrics-generated SC0 score differs from our computed score by a constant of +40 across all 30 respondents (verified: identical SDs, perfect rank correlation). Qualtrics scores the K-MPAI on a 1-7 internal scale, while Kenny (2009) specifies 0-6. Both apply the same reverse coding on the same 8 items – the only difference is a +1 shift per item across all 40 items (40 x 1 = 40). We use the published 0-6 convention. The Qualtrics threshold equivalent of >=105 is >=145.
P1 Familiarity Comparison
Panelist 1 had previously taught Singers 2, 4, and 5 in a classroom setting. Singers 1 and 3 had no prior relationship with Panelist 1. Does this familiarity affect singer HR, singer-Panelist 1 synchrony, or Panelist 1’s own physiological response?
Singer HR by Panelist 1 Familiarity:
| Group | Singers | Mean Song HR | Individual |
|---|---|---|---|
| Familiar (classroom) | S2, S4, S5 | 140 bpm | S2=153, S4=98, S5=169 |
| Unfamiliar | S1, S3 | 150 bpm | S1=149, S3=151 |
The familiar group mean is 10 bpm lower, but this is driven entirely by S4’s outlier-low HR (98 bpm). Without S4, the familiar group mean would be 161 bpm. Classroom familiarity does not predict singer HR.
Singer-Panelist 1 Synchrony:
| Method | Familiar Mean | Unfamiliar Mean | Notes |
|---|---|---|---|
| WCC (mean lag-0 r) | +0.194 | +0.146 | S4-P1 (+0.364) drives familiar |
| Smoothed r | +0.112 | +0.218 | S3-P1 (+0.659) drives unfamiliar |
| Wavelet coherence | 0.440 | 0.553 | S3-P1 (0.679) is highest pair in dataset |
No consistent familiarity advantage. S3-Panelist 1, an unfamiliar pair, shows the strongest multi-scale coupling with Panelist 1 of any pair.
Panelist 1’s Own HR by Session:
| Session | Group | P1 Mean Song HR | P1 Gap Ramp |
|---|---|---|---|
| S1 | Unfamiliar | 104.1 | +5.6 bpm |
| S2 | Familiar | 102.1 | -2.4 bpm |
| S3 | Unfamiliar | 102.5 | -2.0 bpm |
| S4 | Familiar | 100.8 | +8.6 bpm |
| S5 | Familiar | 99.5 | +3.0 bpm |
Panelist 1’s HR decreases monotonically from first to last session (104.1 to 99.5), suggesting habituation to the evaluator role rather than a familiarity effect.
Bottom line: Classroom familiarity with Panelist 1 does not predict singer HR, synchrony, or Panelist 1’s own variability. This null finding is informative: a group classroom relationship does not carry the same physiological weight as a one-on-one studio relationship (where Panelist 3’s two studio dyads both show distinctive coupling patterns).
Singer-by-Singer Comparison
S1, K-MPAI: 126
| Item | Self | P1 | P2 | P3 | P1 mismatch | P2 mismatch | P3 mismatch |
|---|---|---|---|---|---|---|---|
| Confident | 3 | 3 | 2 | 3 | 0 | -1 | 0 |
| Anxious | 4 | 4 | 3 | 4 | 0 | -1 | 0 |
| Authentic | 2 | 3 | 3 | 2 | +1 | +1 | 0 |
| Connected | 1 | 3 | 2 | 1 | +2 | +1 | 0 |
| Disconnected | 4 | 3 | 4 | 5 | -1 | 0 | +1 |
| Enjoyed | 2 | 3 | 2 | 2 | +1 | 0 | 0 |
S1 is the most accurately perceived singer. Panelist 3 shows near-perfect agreement (5 of 6 items exact). All three panelists overestimate S1’s emotional connection, consistent with the general pattern.
S2, K-MPAI: 111
| Item | Self | P1 | P2 | P3 | P1 mismatch | P2 mismatch | P3 mismatch |
|---|---|---|---|---|---|---|---|
| Confident | 4 | 3 | 4 | 2 | -1 | 0 | -2 |
| Anxious | 4 | 4 | 4 | 4 | 0 | 0 | 0 |
| Authentic | 4 | 3 | 4 | 4 | -1 | 0 | 0 |
| Connected | 4 | 4 | 4 | 1 | 0 | 0 | -3 |
| Disconnected | 1 | 4 | 2 | 5 | +3 | +1 | +4 |
| Enjoyed | 5 | 4 | 4 | 2 | -1 | -1 | -3 |
S2 self-reports a positive experience (high confidence, connection, enjoyment) despite having the steepest HR ramp-up. Panelist 3 (S2’s studio teacher) shows the largest divergence of any panelist-singer pair: she rates S2 as disconnected (5/5) when S2 self-reports minimal disconnection (1/5), a mismatch of +4. Panelist 2 is most accurate with S2.
S3, K-MPAI: 144
| Item | Self | P1 | P2 | P3 | P1 mismatch | P2 mismatch | P3 mismatch |
|---|---|---|---|---|---|---|---|
| Confident | 3 | 4 | 4 | 4 | +1 | +1 | +1 |
| Anxious | 4 | 2 | 5 | 2 | -2 | +1 | -2 |
| Authentic | 4 | 4 | 4 | 4 | 0 | 0 | 0 |
| Connected | 4 | 4 | 4 | 4 | 0 | 0 | 0 |
| Disconnected | 2 | 2 | 2 | 2 | 0 | 0 | 0 |
| Enjoyed | 5 | 4 | 4 | 4 | -1 | -1 | -1 |
S3 is the most consistently perceived singer across panelists. All three overestimate confidence by 1 and underestimate enjoyment by 1. The only divergence is on anxiety: Panelists 1 and 3 underestimate it (-2), while Panelist 2 overestimates it (+1).
S4, K-MPAI: 159
| Item | Self | P1 | P2 | P3 | P1 mismatch | P2 mismatch | P3 mismatch |
|---|---|---|---|---|---|---|---|
| Confident | 3 | 3 | 3 | 4 | 0 | 0 | +1 |
| Anxious | 4 | 4 | 5 | 4 | 0 | +1 | 0 |
| Authentic | 3 | 4 | 4 | 4 | +1 | +1 | +1 |
| Connected | 2 | 4 | 4 | 4 | +2 | +2 | +2 |
| Disconnected | 3 | 4 | 3 | 2 | +1 | 0 | -1 |
| Enjoyed | 3 | 4 | 4 | 2 | +1 | +1 | -1 |
S4 self-reports moderate engagement across the board (mostly 3s). All three panelists unanimously overestimate her emotional connection (+2 each), the only item where all three agree on both direction and magnitude. S4 has the second-highest K-MPAI (159) but the lowest HR of any singer, and Panelist 3 (her studio teacher) does not detect this disconnect.
S5, K-MPAI: 174
| Item | Self | P1 | P2 | P3 | P1 mismatch | P2 mismatch | P3 mismatch |
|---|---|---|---|---|---|---|---|
| Confident | 3 | 5 | 5 | 4 | +2 | +2 | +1 |
| Anxious | 4 | 2 | 2 | 4 | -2 | -2 | 0 |
| Authentic | 2 | 4 | 4 | 2 | +2 | +2 | 0 |
| Connected | 4 | 4 | 4 | 1 | 0 | 0 | -3 |
| Disconnected | 4 | 2 | 2 | 5 | -2 | -2 | +1 |
| Enjoyed | 3 | 5 | 4 | 3 | +2 | +1 | 0 |
S5 is the most misperceived singer. He has the highest K-MPAI (174), the highest HR, and self-reports low confidence (3/5) and low authenticity (2/5). Panelists 1 and 2 both rate him as the most confident singer in the study (5/5). Panelist 3 shows a different pattern: she accurately reads his confidence and authenticity but dramatically underestimates his emotional connection (-3). The S5 data suggests that high physiological arousal can read as “confident performance energy” to external observers.
Summary Table
| Singer | Pre-Singing HR | Song 1 HR | Song 2 HR | Reactivity (Song 1 - Baseline) | Activation Gap (Song 2) | K-MPAI | Notes |
|---|---|---|---|---|---|---|---|
| S1 | 128 | 144 | 154 | +16 | +70 | 126 | Steady climber; flattest assigned-song trace |
| S2 | 128 | 160 | 147 | +32 | +66 | 111 | Steepest ramp-up; HR drops for song 2 |
| S3 | 126 | 150 | 152 | +24 | +70 | 144 | Moderate, steady; similar to S2 during assigned song |
| S4 | 91 | 106 | 90 | +15 | +8 | 159 | Outlier – pre-existing relationship with P3; HR near panelist range |
| S5 | 143 | 167 | 170 | +24 | +91 | 174 | Highest absolute HR; no recovery between songs |
All values are mean HR in bpm. Activation gap = singer mean HR minus mean of all three panelists during song 2.
Acknowledgments
Analysis pipeline: HR alignment, statistical analysis, synchrony computations, data visualization, and this interactive archive were developed collaboratively with Claude (Anthropic) under the direction of Kayla Gautereaux. All analytical decisions, interpretations, and methodological choices were made by the research team.
Research assistant: Sarah Kochevar assisted with data collection.
Thesis advisors: Kayla Gautereaux, Megan Stahl, Joshua Gilbert.